01
Context
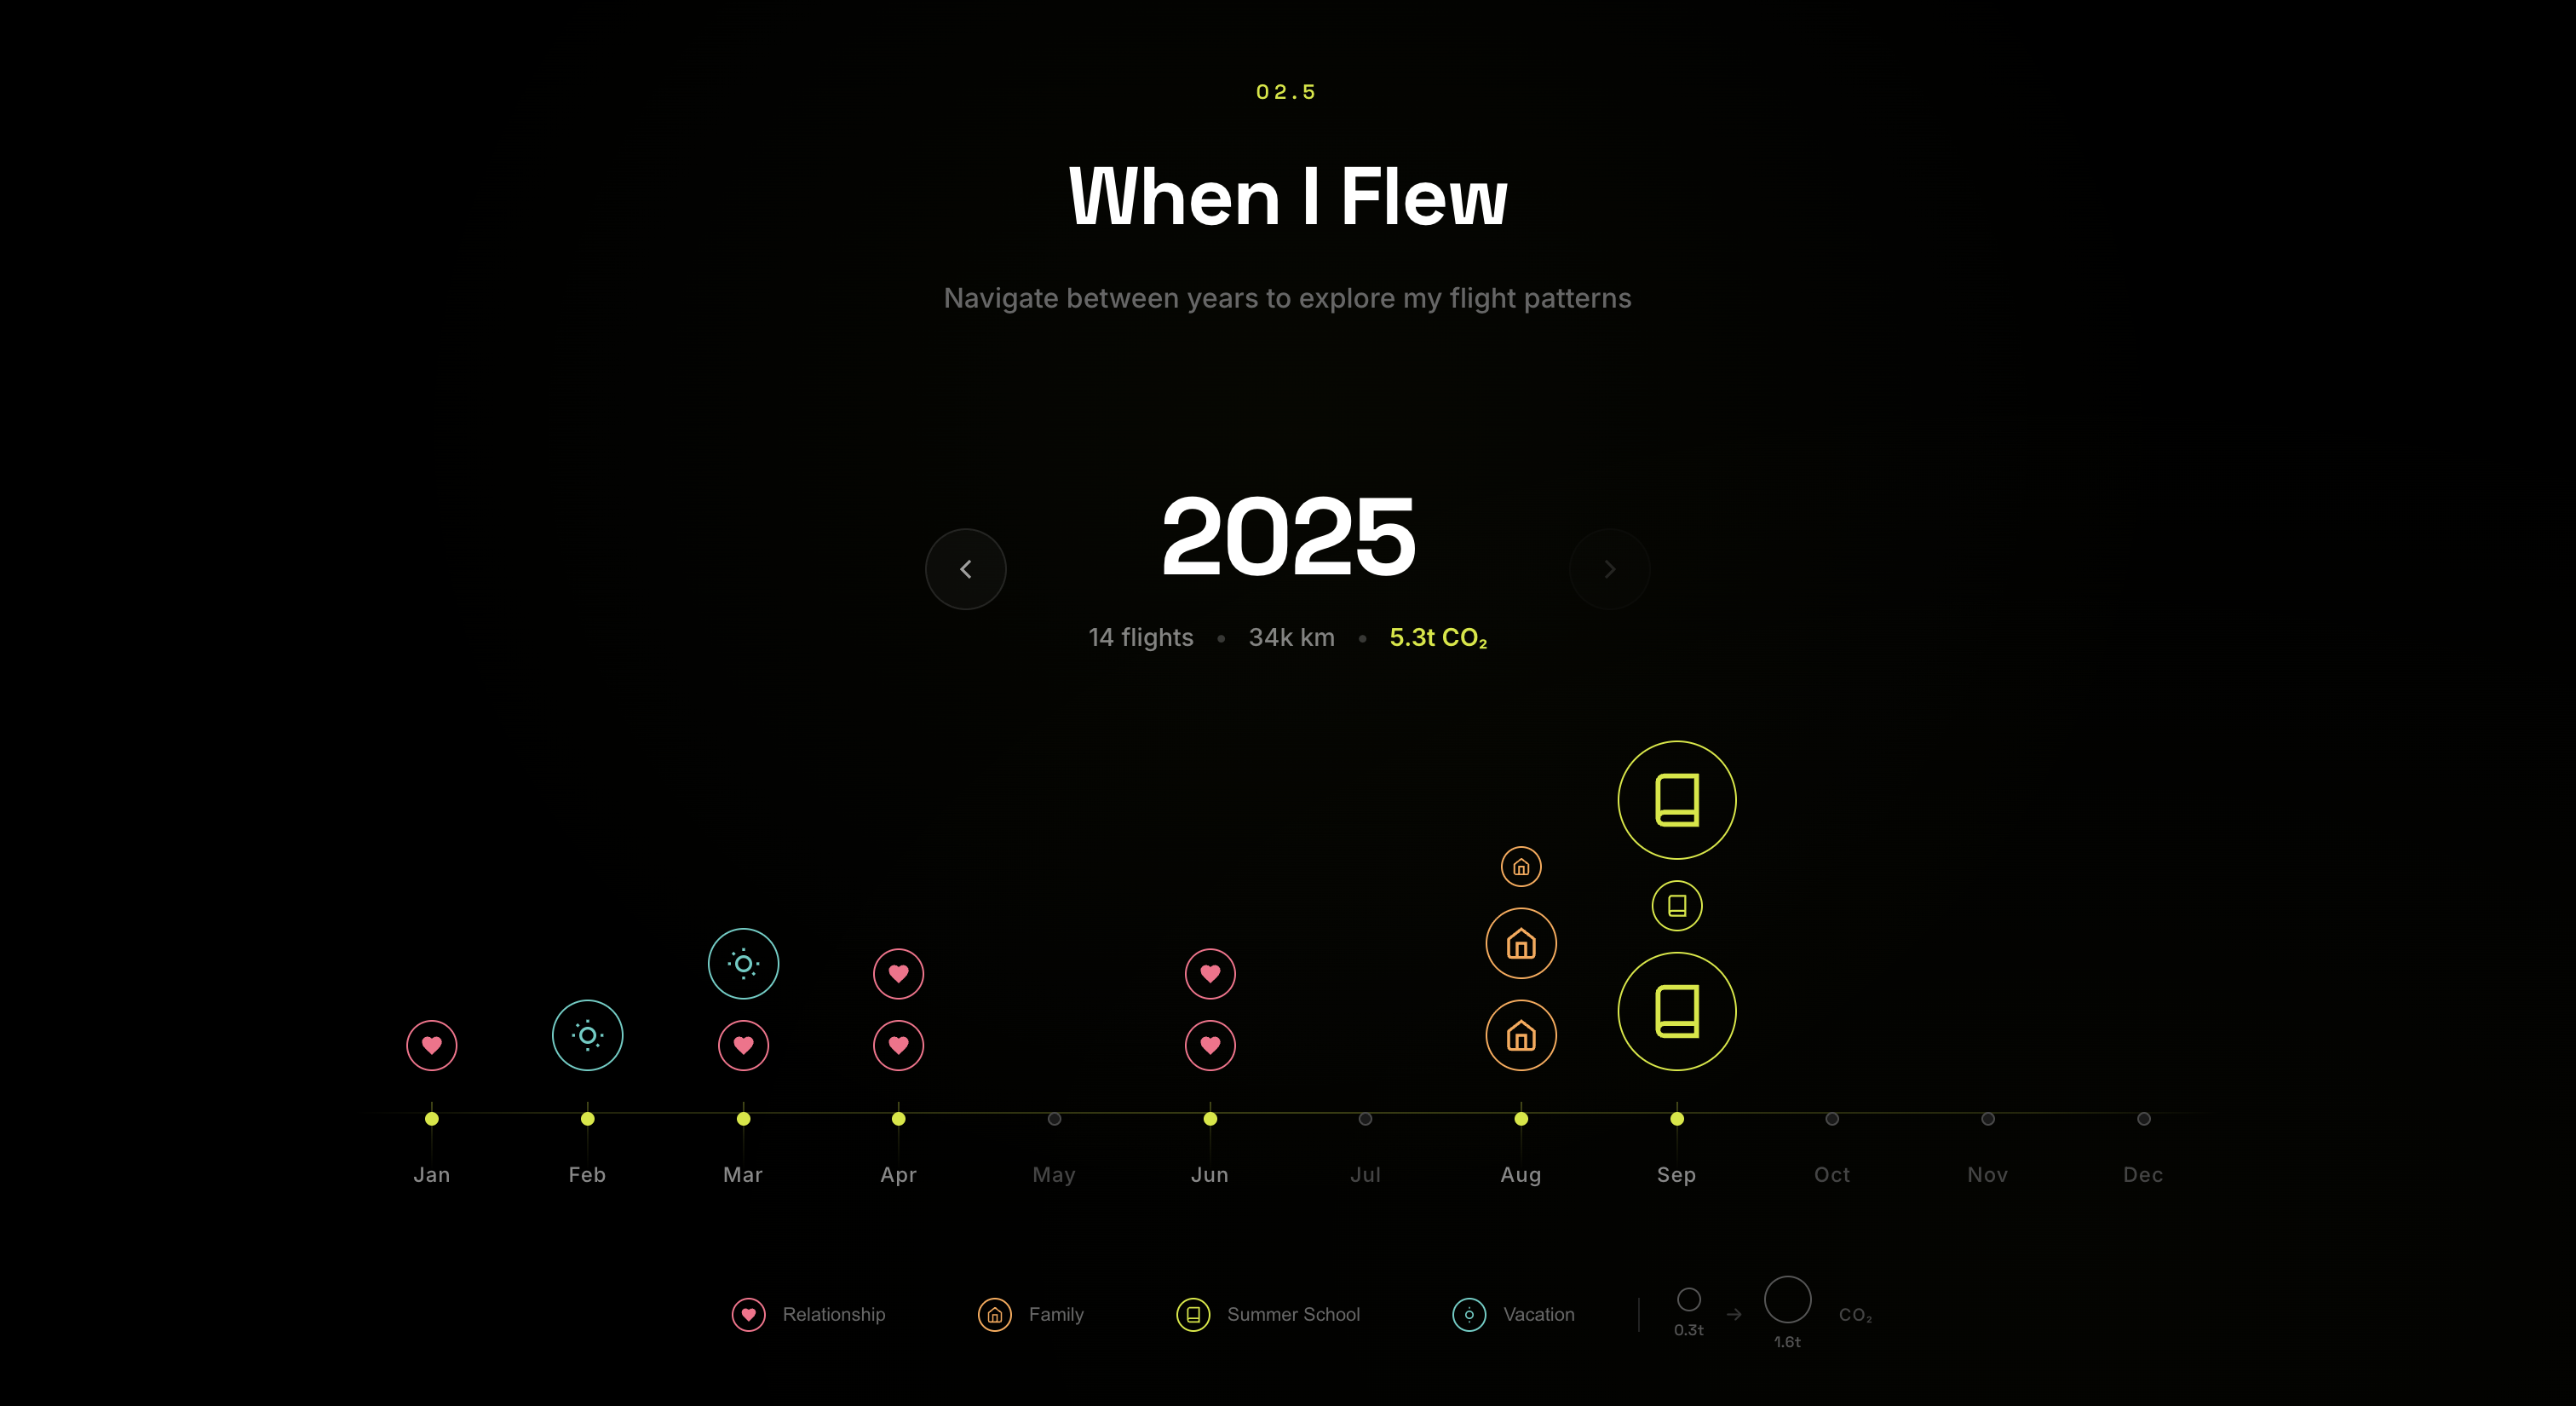
Flight Footprint is a personal data-visualization project from my Information Design course at Hochschule München. It turns my own flight history from 2024 and 2025 into an interactive web experience: 25 flights, 44,138 kilometres and an estimated 7 tonnes of CO₂. Every trip was driven by something human, a long-distance relationship, family, or education, which makes the footprint feel personal rather than abstract.
02
Problem
“What’s the cost of staying connected?” The emissions behind staying close to the people and places that matter are real but invisible. The data that would make them concrete lived scattered across tickets and booking confirmations, and even once gathered, raw tonnes of CO₂ mean little without context or emotion. The challenge was to make a personal emissions total both legible and felt, without turning it into a lecture.
03
Solution
An interactive, scroll-driven web app, built in Svelte, that walks through the footprint from five angles: a 3D globe of every route, a 2D map from Munich, a timeline colour-coded by reason, a bar chart that sets my 7 tonnes against climate benchmarks, and a photo archive that gives the numbers a human face. Data was hand-collected from every ticket and emissions estimated with the ICAO methodology. The narrative moves from global scale to personal memory, keeping the data emotionally accessible while leaving the central question deliberately open.